Skip to Content (custom)
Login
Login
Lytx Account
Lytx Compliance Services (RAIR)
Surfsight Cloud
Surfsight Partner Portal
Get Pricing
Toggle Navigation (custom)
Improve Driver Safety
Operate Efficiently
Manage Compliance
Retain Drivers
search
What are you searching for?
Start your search
Featured Posts
Newsletter
How to Improve Safety Culture: 6 Trucking Industry Tips
In the transportation industry, there can be a tug of war between the Operations Department, tasked with getting things done, and the Safety Departmen...
Newsletter
How Ryder Is Staying One Step Ahead of Driver Fatigue
Driver fatigue among commercial drivers is attracting more attention these days. As reported by the US Department of Transportation, distracted and dr...
Newsletter
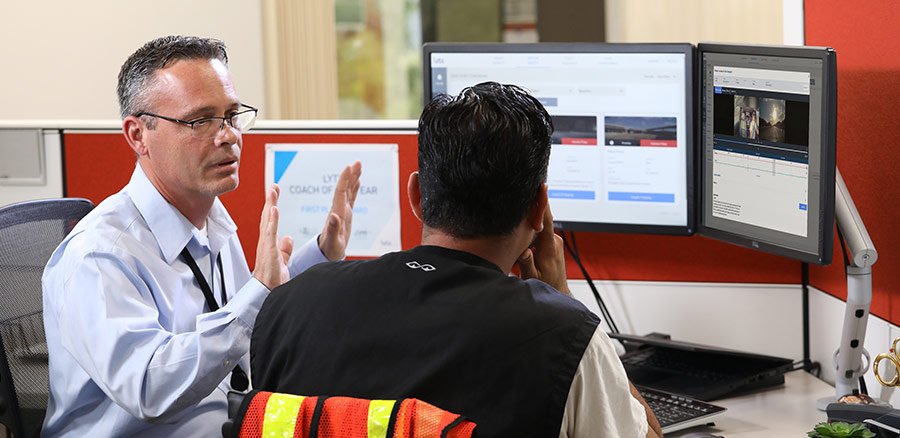
How to Get to 100 Percent Coaching Effectiveness
What does it take to achieve 100 percent coaching effectiveness? To find out, we turned to Stillwater, Oklahoma. Nestled in the north-central region o...
Newsletter
Driver Incentive Programs and Coaching: Working Together to Retain Drivers
Finding workers who are a great fit for your organization can be like looking for a needle in a haystack. And keeping them? That can be even harder. S...
More newsletters
HR: Setting the Tone on Safety
There’s a lot more to human resources than benefits and time-off requests. The department plays a vital role in designing and weaving a company&...
How Ryder Is Staying One Step Ahead of Driver Fatigue
Driver fatigue among commercial drivers is attracting more attention these days. As reported by the US Department of Transportation, distracted and dr...
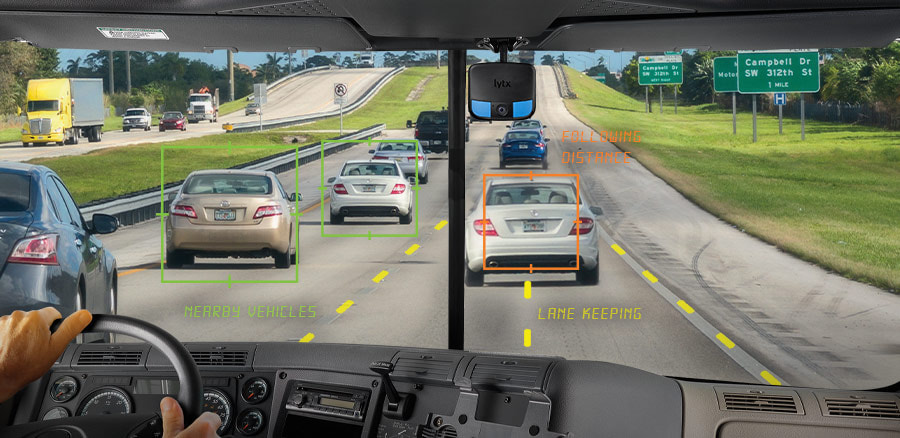
Machine Vision + Artificial Intelligence: Transportation's Fast Lane to Innovation
Imagine a world where all vehicles are equipped with technology that allows them to “see” the world around them. Such technology could ser...
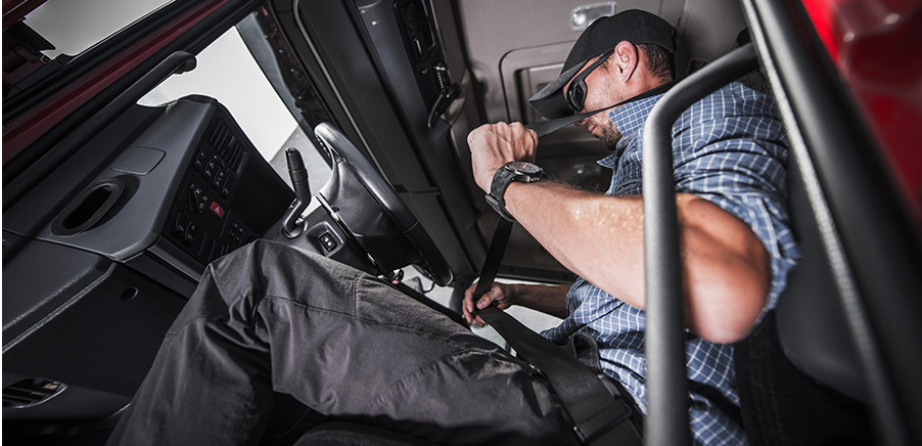
What Driving Without a Seat Belt Says about Your Drivers
Most people wouldn’t consider walking alone down a dark alley at night when there is a well-lit and busy sidewalk nearby. Yet drivers who don&rs...
Overcoming Trust Issues with Vehicle Cameras
Learn three convincing ways fleets earn trust and buy in on the uses of vehicle cameras.
How to Attract a New Generation of Drivers – Recruitment Guide
Millennials account for more than one-third of the U.S. employee population and more are entering the workforce every day, making this gener...
High-Impact, Low-Cost Ways to Improve Driver Retention
To hear drivers talk about their jobs, you’d think they inspired Rodney Dangerfield’s famous catchphrase, “I don’t get no resp...
Leadership Lessons: Transforming from Awareness to Ownership
“If the rate of change outside of your team or organization is faster than the rate of change inside, then you’re becoming less relevant.&...
Predict and Prevent Your Next Big Collision
Predict & Prevent Your Next Big Collision Using This Surprisingly Simple Technique It’s easy to get overwhelmed by the many ways tha...
The 2019 Lytx Driver of the Year and Coach of the Year Award Winners
The 2019 Lytx Driver and Coach of the Year award recipients demonstrate that safe driving is the product of continuous learning, and that a deep-seede...
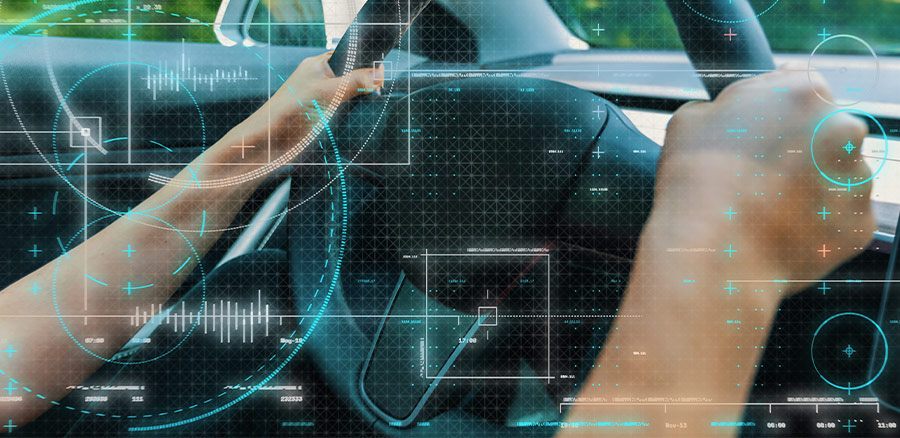
Can Artificial Intelligence Be Used to Improve Driver Performance?
There’s no question human intelligence outperforms artificial intelligence and will continue to do so for many years to come. But that doesn&rsq...
Enhancing Your Fleet with a Machine Vision System
Machine vision may sound like the technology in a futuristic sci-fi movie, like HAL in “2001: A Space Odyssey” or “Auto,” the ...
Pagination.PreviousPage
1
2
3
Pagination.NextPage